
Leverage Education Analytics for better Insights on Student Success
Empowering educators with data-driven insights to enhance student learning outcomes and institutional efficiency.

100+ Graduate Programmes in Top Institutions Globally


Crux of Analytics
Value to be extracted
Optimize your institution's performance and resource management with data-driven insights through Academic Operations Analytics, ensuring efficient and effective educational delivery.
Empower your leadership with actionable insights, enabling data-informed decisions that drive strategic growth and operational excellence.
Leverage comprehensive reports that provide in-depth analysis, helping you to identify trends, measure performance, and make informed decisions with confidence.
Enable your team to independently explore data and generate insights with intuitive self-service analytics tools, fostering a culture of data-driven decision-making.
Experience seamless data integration with EDTEX SaaS, providing unified views across all your educational data to enhance analysis and decision-making.
Ensure that every team member receives relevant data with role-specific access to insights, empowering informed decisions at every level of your organization.
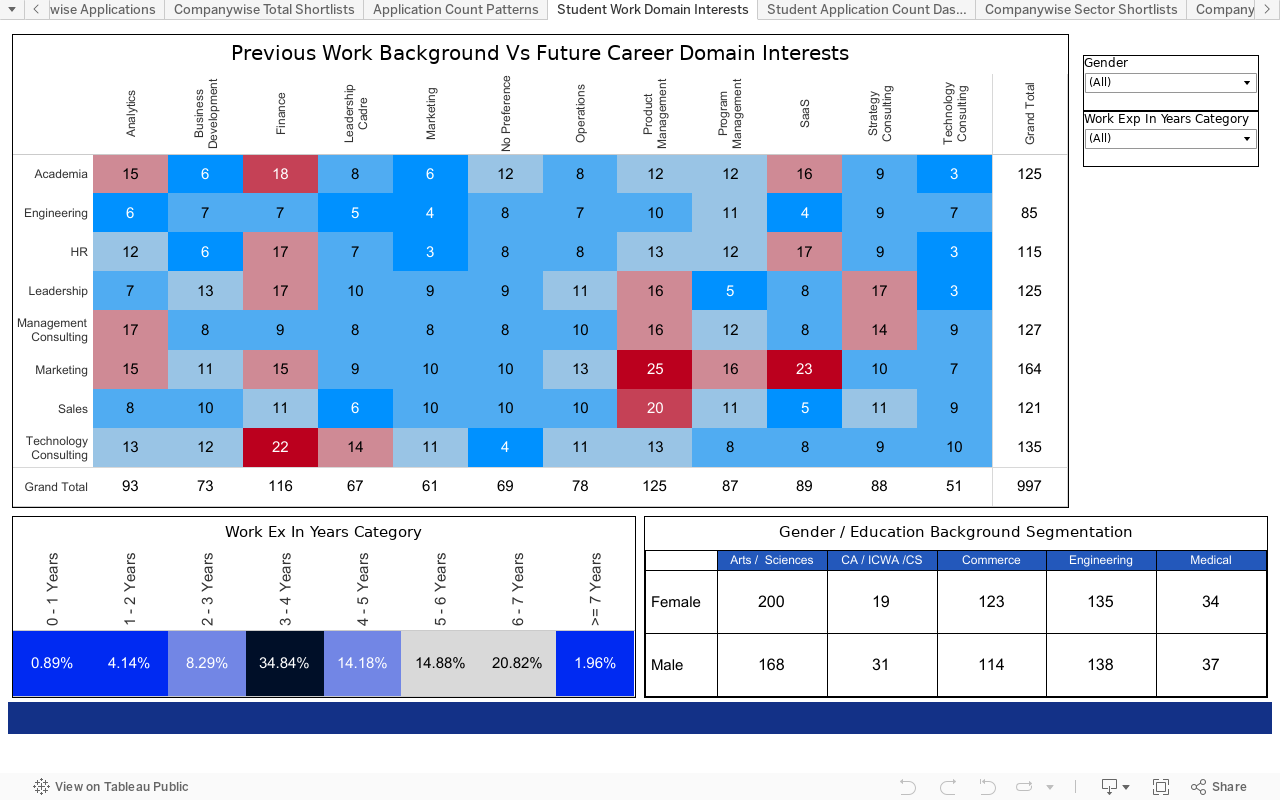
Academic Operations Analytics
Cross Functional insights will allow data driven decision making toward achieving overall efficiencies
From Our Customers
Streamline processes & improved operational efficiencies.
EDTEX Skynet transformed our placement process by digitalizing workflows and making key data easily accessible. For the Placement Office, its interactive dashboards provide actionable insights, improving placement outcomes and student preparation. For students, it’s a one-stop platform for tracking progress and accessing placement data. For the Placement Committee, it simplifies data collection, job postings, applications, and communication, ensuring a seamless and efficient process.

The whole platform (Skynet - Placement Automation) is very well automated. The team was present for the entire cycle, providing robust services.

Had a really positive experience using this portal for my colleges placement process. The team was also very helpful in resolving any issues ASAP.

I strongly recommend EDTEX to anyone who is looking for software solutions related to any academic and placement related activities. Their team will be there to support you always, their solutions are also fool proof.

I had the pleasure of using EDTEX Skynet for conducting placement operations for SIPs & final placements. Skynet is customizable, allowing us to design the platform entirely around our specific processes. The team is knowledgeable & experienced in managing placement processes for top B-schools. What truly sets them apart is their 24x7 support. Any issues we encountered were resolved promptly, even under tight deadlines. I highly recommend Skynet to any institution running placement processes.

We had an exceptional experience with the Skynet portal, developed by EdTex, during the placement process at IIM Lucknow. The platform's automation of scheduling interviews and GDs played a pivotal role in ensuring a smooth and seamless placement process. A special mention to Shrikant, Abdullah, and Anil for their unwavering support throughout the placement season. Their availability, even at odd hours like 12 AM, ensured a hassle free experience for both students and recruiters.

The Team EDTEX successfully helped automate the Day Placement Process at XLRI that includes scheduling and real-time student tracking. During the pandemic time, they came up with an innovative Virtual Placements Automation Software that provided interfaces to students as well as companies. Using Skynet Virtual Placement solution, XLRI has conducted the Summer Internship Process (SIP) virtually.

EDTEX - Skynet Product Team have rendered their services and support through Placement Automation Software for the Online Placement Process at IIM Bangalore since March 2020. The software has been successfully implemented and rendered

Team EDTEX did a great job in automating the comprehensive placement process of IIM Lucknow. Skynet helped streamline the entire placement process across the entities: recruiters, students, and the placement team and facilitated smooth communication flow. Skynet was proactive in terms of understanding the data requirements and their use cases to present them in easy to consume from.

We are happy to recommend the Course Bidding System software, which was developed by our student and alumnus Mr. Anil Kumar Vishwanadhula for IIMA.

IIMB is extremely satisfied with the efficient support being provided by the EDTEX team during the Course Bidding rounds and while scheduling the term Timetable.

EDTEX did an excellent job of integrating and automating all the activities of our admissions process including shortlisting, scheduling of personnel interviews and generating the list of final selected candidates in an extremely user-friendly product.

EDTEX team, led by Anil and Arun, worked closely with our team for the last two years in a row to make a successful pivot from physical recruitment processes to one that is completely driven online. The team has ideated and helped in successful execution of virtual placements for one of the largest recruitment drives in India. This year with 900 plus students in the ISB PGP Class of 22, the end-to end conceptualization and execution of digital placements was done in partnership with the Edtex team.


Top 5 Question we get
How, What, Do you..
1. Student Experience: Enhance the overall student experience by analyzing feedback, engagement metrics, and campus services usage.
2. Student Success and Retention:Monitor and improve student performance, retention rates, and graduation rates by identifying at-risk students and implementing targeted interventions.
3. Resource Allocation: Optimize the allocation of resources such as faculty, classrooms, and funding based on data-driven insights into usage patterns and needs.
4. Curriculum Development: Enhance and update curriculum based on analysis of student performance data, industry trends, and feedback.
5. Operational Efficiency: Streamline administrative processes, reduce costs, and improve the overall efficiency of university operations.
6. Research and Innovation: Support research activities by providing robust data analytics tools to analyze research data and foster innovation.
7. Enrollment Management: Improve recruitment strategies and enrollment processes by understanding demographic trends, applicant profiles, and admission yield rates.
8. Financial Planning: Inform financial decision-making and budget planning through detailed analysis of financial data and projections.
9. Compliance and Accreditation: Ensure compliance with accreditation standards and regulatory requirements by providing comprehensive data reporting and analysis.
10. Alumni Engagement: Track and analyze alumni data to improve engagement strategies, fundraising efforts, and alumni relations.
In the context of university operations, the analytics tool offers the following specific capabilities:
1. Predictive Analytics: Identify at-risk students and predict their likelihood of success.Forecast enrollment trends and financial projections.Predict course demand to optimize scheduling and resource allocation.
2. Real-Time Data Analysis: Monitor real-time student engagement and participation.Track real-time resource usage such as library occupancy and lab equipment.Analyze real-time data from campus events and activities.
3. Data Visualizations: Create interactive dashboards for student performance, retention rates, and graduation rates.Visualize financial data, including budgeting and expenditures.Develop visual reports on faculty performance and research output.
4. Descriptive Analytics: Analyze historical data to understand past trends in enrollment, retention, and graduation.Evaluate the effectiveness of previous interventions and programs.Benchmark university performance against peer institutions.
5. Diagnostic Analytics: Identify factors contributing to student dropout rates.Analyze the causes of underperformance in specific courses or departments.Determine reasons for resource underutilization or overutilization.
6. Sentiment Analysis: Analyze student and faculty feedback from surveys and social media.Understand campus sentiment regarding policies, events, and services.
7. Operational Efficiency Analytics: Assess the efficiency of administrative processes and identify bottlenecks.Optimize maintenance schedules and facility management.
8. Custom Reporting: Generate customized reports for accreditation purposes and compliance requirements.Create tailored reports for different stakeholders, including faculty, administration, and trustees.
9. Geospatial Analytics: Analyze geographic data related to student demographics and recruitment efforts.Visualize campus safety and security data on maps.
10. Integration Capabilities: Integrate with existing university systems such as Learning Management Systems (LMS), Student Information Systems (SIS), and financial software.Enable seamless data flow and comprehensive analysis across various departments.These capabilities help universities make data-driven decisions, enhance student outcomes, and improve overall operational efficiency.
Yes, many universities have successfully implemented analytics tools to enhance their operations. Here are a few examples and case studies:
Tool: Tableau
Outcome:
- XLRI Jamshedpur – The placement Convener and Office gleans complete insights into its end to end placements process outcomes through Tableau analytics dashboards
- IIM Trichy – The placementChairperson and Office obtain insights into its end to end placements process outcomes through Tableau analytics dashboards
- The University of California, Irvine, leveraged Tableau for data visualization and analysis. The tool enabled the university to create interactive dashboards for tracking enrollment, financial data, and student outcomes, resulting in more informed decision-making.
An analytics tool for university operations can help track a variety of metrics and key performance indicators (KPIs) to ensure that institutional goals are met. These metrics and KPIs typically fall into several key areas:
1. Student Success and Retention:Retention Rates: Percentage of students who continue their studies from one year to the next.
a. Graduation Rates: Percentage of students who complete their degree programs within a specified time frame.
b. Course Completion Rates: Percentage of students who successfully complete courses they enroll in.
c. GPA Trends: Average GPA trends over time to monitor academic performance.
d. Student Engagement: Metrics such as class attendance, participation in extracurricular activities, and use of academic resources.
2. Enrollment Management:Application and Acceptance Rates: Number of applications received and the percentage of those accepted.
a. Enrollment Yield: Percentage of accepted students who enroll.
b.Demographic Data: Breakdown of student demographics including age, gender, ethnicity, and geographic origin.
c. Enrollment by Program: Number of students enrolled in each academic program.
3. Resource Allocation and Utilization:
a. Classroom Utilization Rates: Percentage of classroom space used versus available.
b. Faculty Workload: Distribution of teaching, research, and administrative responsibilities among faculty.
c. Library and Lab Usage: Frequency and extent of use of libraries and laboratories.
4. Financial Performance:Tuition Revenue: Income generated from student tuition fees.
a. Grant and Research Funding: Amount of funding received for research projects.
b. Expenditure Tracking: Analysis of expenses by department and category.
c. Cost per Student: Average cost of educating each student.
5. Operational Efficiency:
a. Administrative Process Efficiency: Time and resources required to complete administrative tasks.
b. Facility Maintenance Costs: Costs associated with maintaining campus facilities.
c. Energy Consumption: Metrics related to energy usage and sustainability initiatives.
To ensure the Analytics tool remains compliant, it is essential for universities to work closely with the tool provider, stay informed about regulatory changes, and actively participate in any offered training or update briefings. This collaboration helps in promptly addressing compliance needs and maintaining the integrity and reliability of the analytics tool.
.svg)
Visualise University Automation
Discuss about your Operational Process Pain-points
Discover the Gaps and apply Targeted Solutions
Experience Automation powered Student Success with 10X Impact